
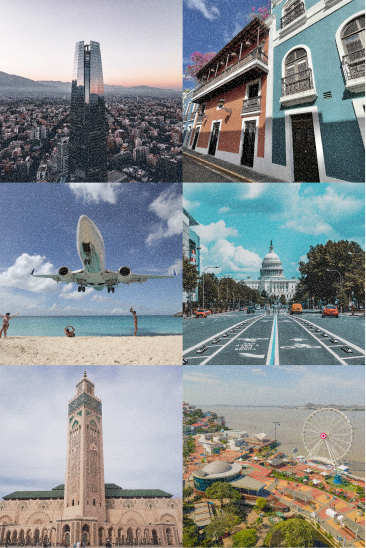


Fastest Growing Destinations
Year-over-year growth in bookings by destination
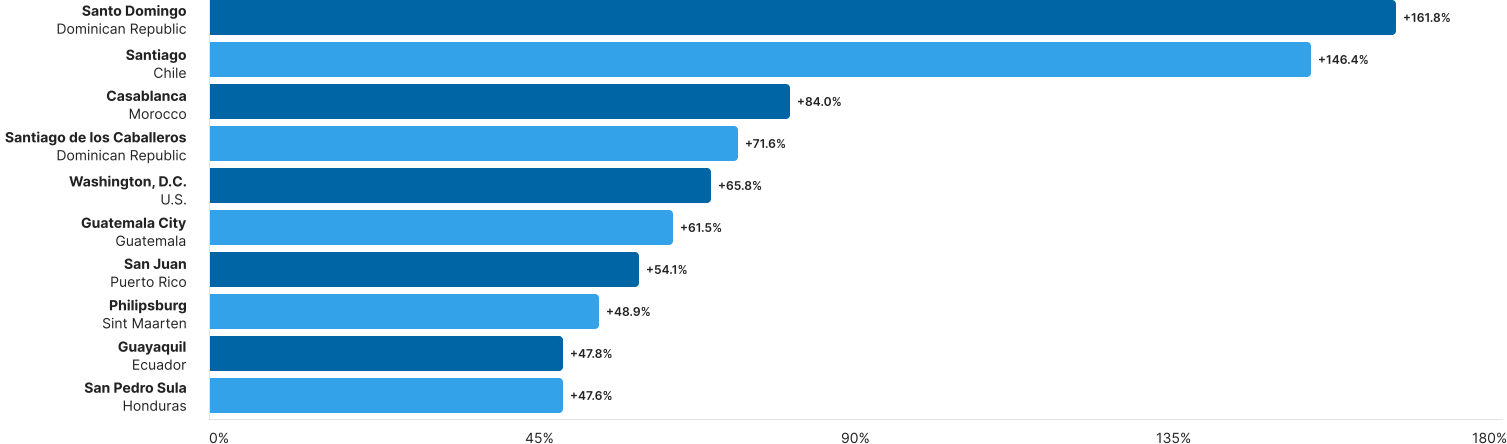
Aside from Casablanca’s route-driven surge, real organic growth is concentrated in the Caribbean and Latin America.

Biggest Declines
Year-over-year decline in popularity by destination
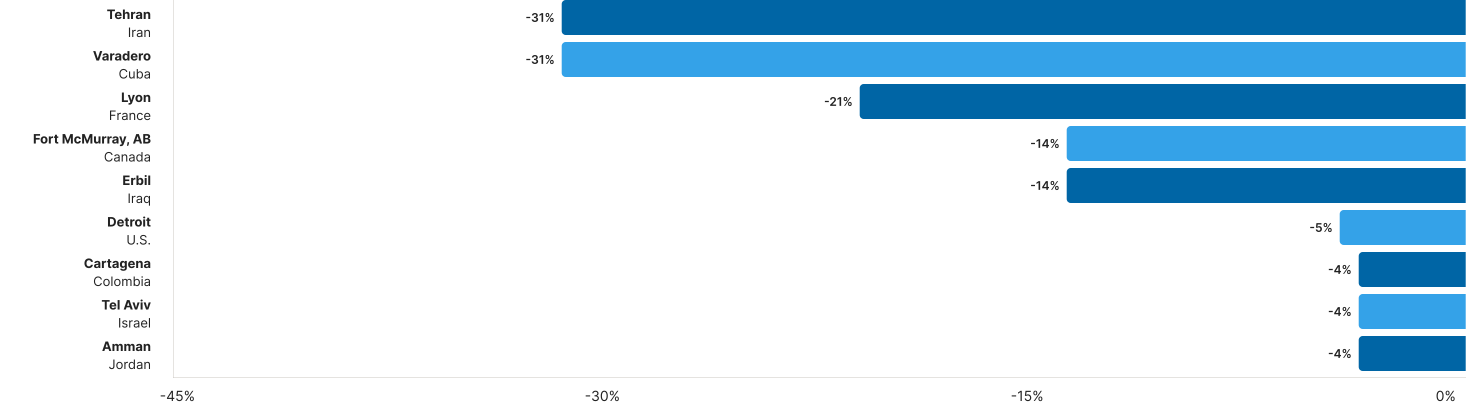
Sizeable declines are the exception this year, not the rule. Most of the market is growing.

Most Affordable International Destinations
U.S. & Canada comparison
| Rank | Canada (CAD/pax) | United States (USD/pax) |
|---|---|---|
| 1 | Nassau — $439 | San Juan — $253 |
| 2 | Aruba — $526 | Bogotá — $407 |
| 3 | Cancún — $534 | Cancún — $526 |
| 4 | Sint Maarten — $556 | Guadalajara — $545 |
| 5 | Puerto Vallarta — $556 | Mexico City — $581 |
| 6 | Liberia, Costa Rica — $560 | Medellín — $617 |
| 7 | Montego Bay — $596 | San Salvador — $634 |
| 8 | Belize City — $619 | Lima — $679 |
| 9 | Punta Cana — $632 | Paris — $849 |
| 10 | Mexico City — $634 | Rome — $888 |
The Caribbean and Central America remain the cheapest international destinations from both Canada and the U.S.

Trending Long-Haul Markets
U.S. & Canada comparison
| Destination | Canada (CAD/pax, nights) | United States (USD/pax, nights) |
|---|---|---|
| Casablanca | $997 / 15 nights | $938 / 13 nights |
| Punta Cana | $632 / 7 nights | $366 / 7 nights |
| Liberia, Costa Rica | $560 / 9 nights | $382 / 7 nights |
| Los Cabos | $623 / 7 nights | $578 / 5 nights |
| Aruba | $526 / 7 nights | $327 / 6 nights |
| Douala | $1,560 / 21 nights | $1,566 / 16 nights |
| Guangzhou | $1,504 / 21 nights | $969 / 15 nights |
Long-haul fares vary enormously by destination, from budget Caribbean hops to premium West/Central African routes.
Overall Top 10 Destinations Canada

Outbound Canada
(International, excluding U.S.)- 1.Delhi ↑1
- 2.Tokyo ↓1
- 3.London −
- 4.Cancún ↑1
- 5.Paris ↓1
- 6.Manila −
- 7.Lisbon −
- 8.Puerto Vallarta ↑2
- 9.Hong Kong ↓1
- 10.Rome ↓1

Inter-Canada
(Domestic)- 1.Toronto −
- 2.Vancouver −
- 3.Calgary −
- 4.Montreal ↑1
- 5.Edmonton ↓1
- 6.Halifax −
- 7.Ottawa ↑1
- 8.Kelowna ↑1
- 9.Winnipeg ↓2
- 10.Victoria −

Inbound Canada
(Foreign, excluding U.S.)- 1.Toronto −
- 2.Vancouver −
- 3.Montreal −
- 4.Calgary −
- 5.Edmonton −
- 6.Ottawa −
- 7.Halifax ↑1
- 8.Winnipeg ↓1
- 9.Québec City −
- 10.Victoria ↑1
Overall Top 10 Destinations U.S.
U.S.
Outbound U.S.
(International, excluding Canada)- 1.Tokyo −
- 2.San Juan ↑2
- 3.London ↓1
- 4.Paris ↓1
- 5.Mexico City ↑1
- 6.Cancún ↓1
- 7.Rome −
- 8.Santo Domingo ↑28
- 9.Seoul ↓1
- 10.Milan ↑3
Inter-U.S.
(Domestic)- 1.New York −
- 2.Orlando −
- 3.Fort Lauderdale ↑2
- 4.Los Angeles ↓1
- 5.Las Vegas ↓1
- 6.Bay Area ↑2
- 7.Seattle ↓1
- 8.Miami ↑2
- 9.Washington, D.C. ↑5
- 10.Chicago ↓3
Inbound U.S.
(Foreign, excluding Canada)- 1.New York −
- 2.Los Angeles −
- 3.Washington, D.C. ↑1
- 4.Bay Area ↓1
- 5.Miami ↑1
- 6.Chicago ↓1
- 7.Boston −
- 8.Orlando −
- 9.Dallas −
- 10.Seattle ↑2
The US–Canada corridor
Overall year-over-year growth (search interest)
Canada to U.S.
+2.0%
U.S. to Canada
+16.0%
Top destinations, Canada → U.S.
YoY growth
| Rank | Destination | YoY growth |
|---|---|---|
| 1 | New York | +4.2% |
| 2 | Fort Lauderdale | +3.2% |
| 3 | Orlando | −1.5% |
| 4 | Los Angeles | −3.6% |
| 5 | Las Vegas | −18.7% |
| 6 | Miami | +13.4% |
| 7 | Bay Area | +14.1% |
| 8 | Washington, D.C. | +22.8% |
| 9 | Phoenix | −3.2% |
| 10 | Chicago | +17.7% |
Cross-border interest from Canada into the U.S. is growing modestly, with Washington, D.C. the standout gainer.
Top destinations, U.S. → Canada
YoY growth
| Rank | Destination | YoY growth |
|---|---|---|
| 1 | Toronto | +20.2% |
| 2 | Vancouver | +20.0% |
| 3 | Calgary | +11.5% |
| 4 | Montreal | +18.5% |
| 5 | Edmonton | +1.6% |
| 6 | Ottawa | +7.7% |
| 7 | Québec City | −0.4% |
| 8 | Halifax | +8.9% |
| 9 | Winnipeg | +3.8% |
| 10 | Victoria | +16.3% |
Interest from the U.S. into Canada is growing much more strongly, led by Toronto and Vancouver.