
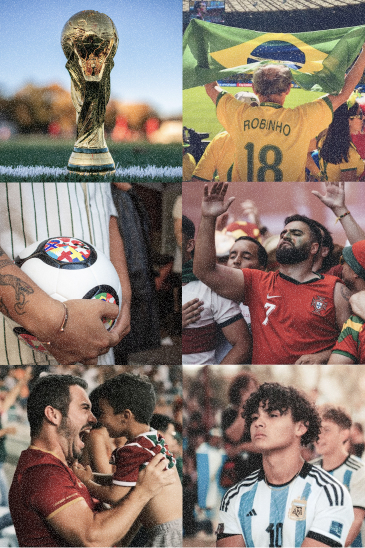


Which host cities attracted the most travellers?
Between the U.S., Mexico, and Canada
| City | vs. last year | vs own normal |
|---|---|---|
| Toronto | +18% | +7% |
| Vancouver | +34% | +23% |
| New York / New Jersey | +24% | +34% |
| Miami | +7% | -22% |
| Boston | +78% | +41% |
| Mexico City | +40% | -3% |
| Kansas City | +165% | +74% |
| Monterrey | +69% | +68% |
Some Cities Aren’t Just Growing, They’re Breaking From the Norm.
The strongest growth is coming from cities that are moving well beyond their usual travel patterns. Kansas City stands out, up 165% year over year and 74% above its own normal, while Boston and Monterrey are also showing significant momentum. Vancouver and New York/New Jersey are seeing meaningful gains on both measures. Miami and Mexico City tell a different story: both are up from last year, but remain below their typical levels, suggesting their growth is more of a recovery than a true surge.


Arrivals didn’t spike on match days.
Travel built up steadily through the tournament rather than spiking around individual matches.

Where did Canadians travel from to attend matches?
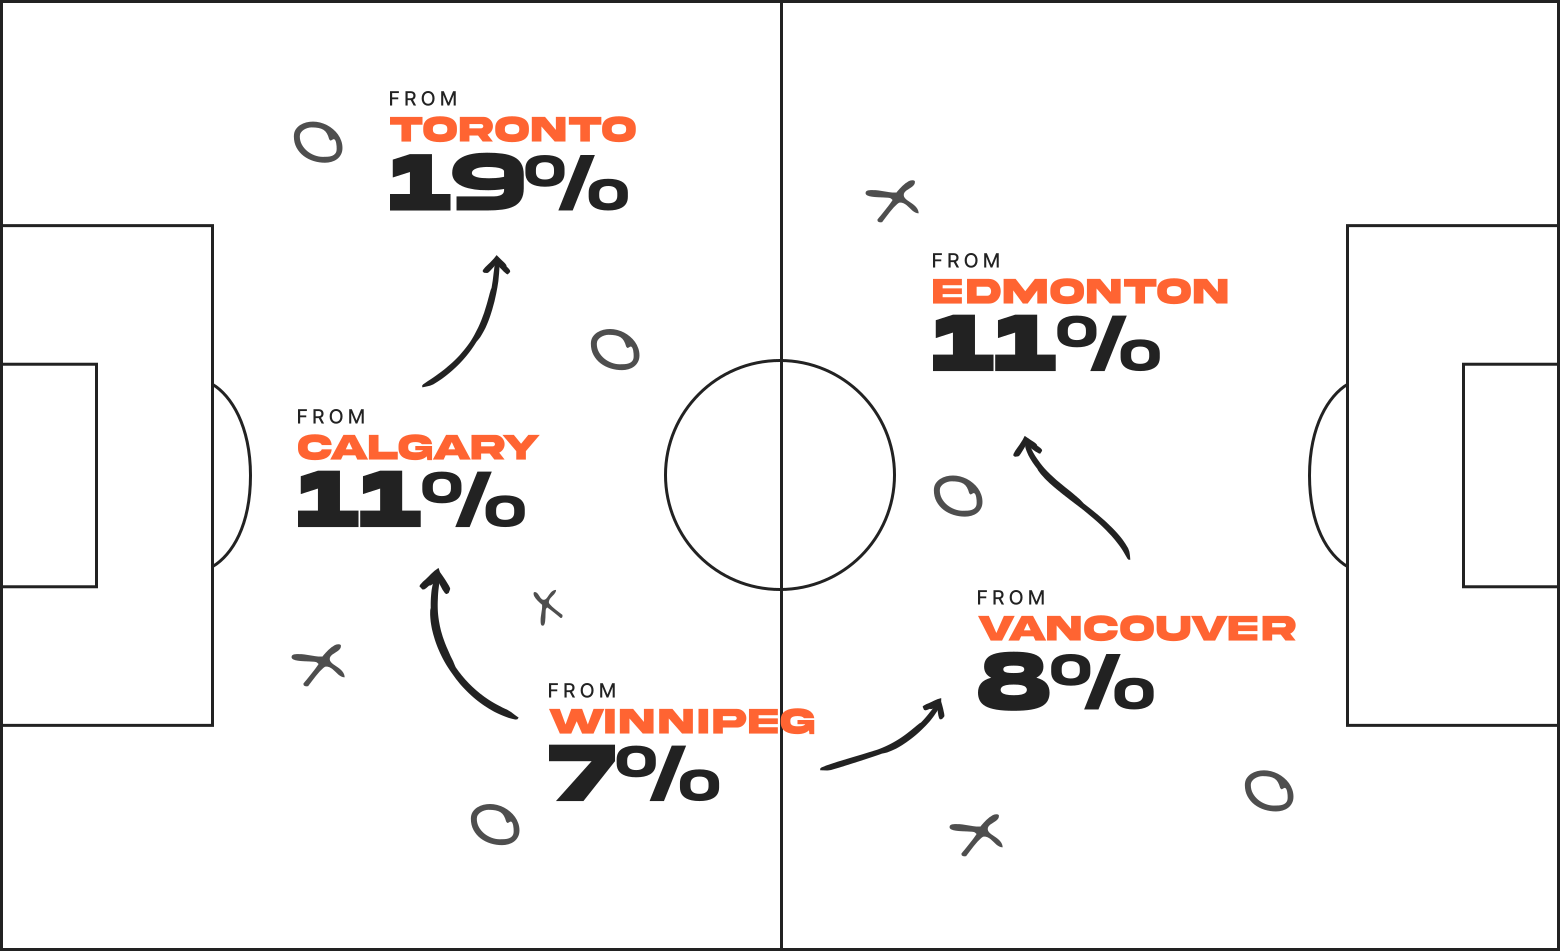
Toronto and Vancouver captured over one quarter of booking data, 19% and 8% respectively.
Canadian World Cup travel was overwhelmingly domestic.

Which international markets travelled into host cities?

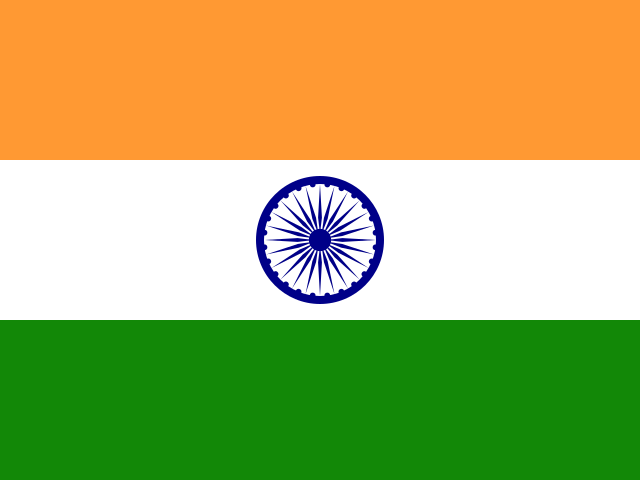


India, Philippines, China

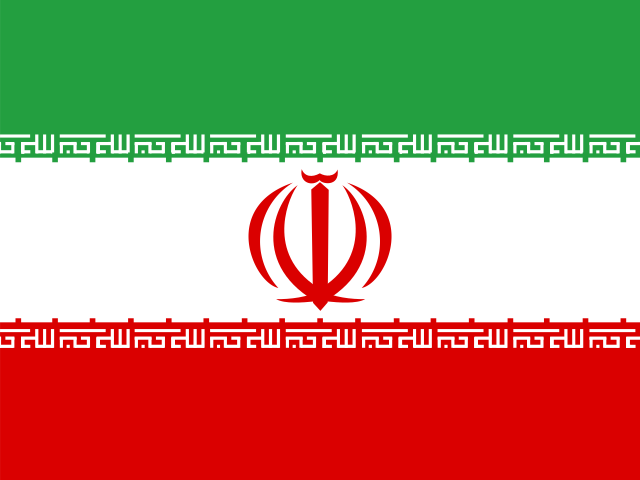
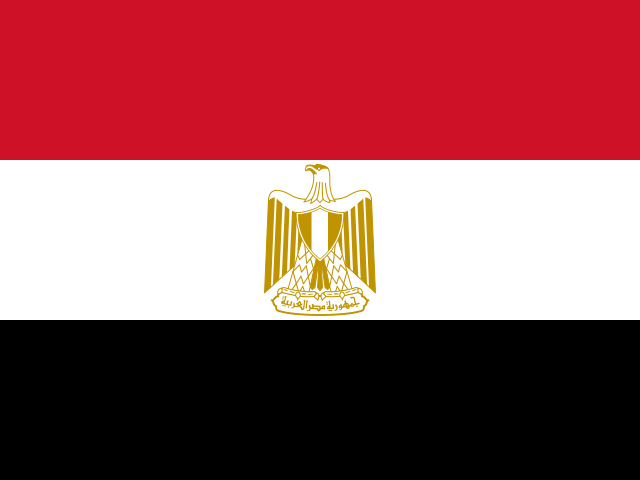
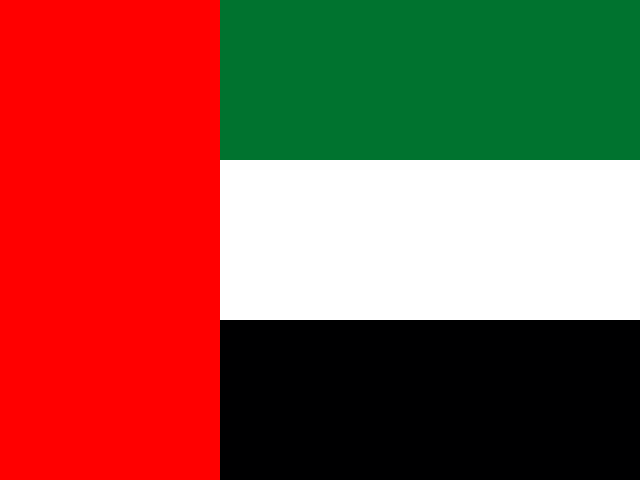
Iran, Egypt, UAE
India, the Philippines, and China were the biggest non-North-American sources into host cities, consistent with FlightHub’s usual customer base rather than World-Cup-specific demand.
Who booked more?

49.9%
U.S.-origin travellers

28.7%
Canadian-origin travellers
U.S. travellers booked flights to host cities nearly 2× as often.
Who waited longer to book?

U.S.
16 days
Before departure

Canada
22 days
Before departure
Americans booked closer to kickoff.
Did World Cup hype make people book earlier?
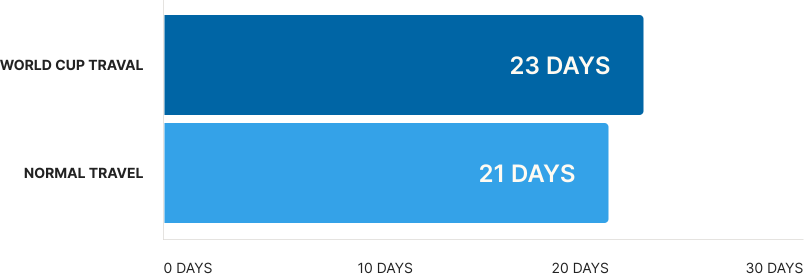
Despite the hype, travellers booked only 2 days earlier than usual.