



The Non-World-Cup Events That Moved the Needle
Only 3 of 8 Events Show a Real Lift
| Rank | Event (destination) | vs. last year | vs. own trailing 8-week baseline |
|---|---|---|---|
| 1 | Mardi Gras (New Orleans) | +54.2% | +102.5% |
| 2 | Winter Olympics (Milan+Venice) | +243% | +83.0% |
| 3 | Canadian Grand Prix (Montréal, 24 May) | +31.7% | +19.5% |
| 4 | F1 Las Vegas | −21.5% | −9.3% |
| 5 | Stagecoach (Palm Springs) | +77.5% | −12.9% |
| 6 | Super Bowl LX (Bay Area) | +44.4% | −14.9% |
| 7 | Coachella (Palm Springs) | +26.4% | −31.0% |
| 8 | F1 Miami | +34.9% | −32.6% |
Not Every Big Event Creates a Travel Boom.
Only three of eight events lifted bookings against both last year and recent trends. Mardi Gras had the strongest underlying impact (+102.5% vs. baseline), while the Winter Olympics saw the biggest year-over-year gain (+243%). The Canadian Grand Prix also delivered a smaller but meaningful boost.
Stagecoach, the Super Bowl, Coachella and F1 Miami grew year over year but remained below recent baselines, showing that YoY growth doesn’t always signal event-driven demand. F1 Las Vegas declined on both measures.

Which events make people book earliest?
Gap vs. matched non-event baseline, in days.
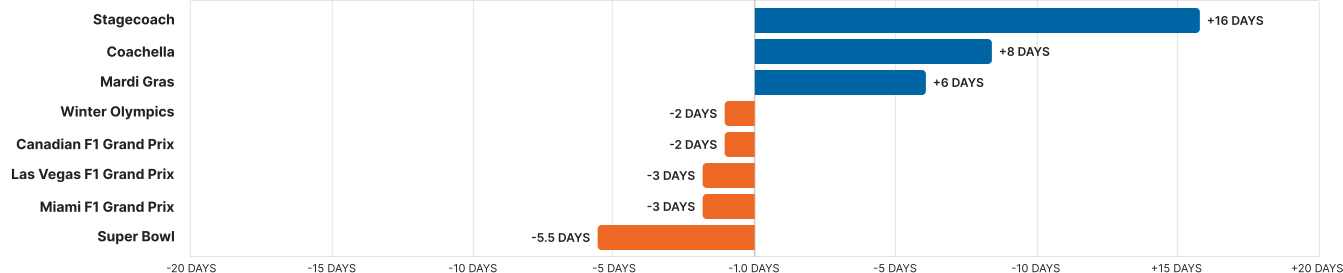
Which Events Make Travellers Book Earlier?
Stagecoach drives the biggest shift in booking lead time, with travellers booking 16 days earlier than usual, followed by Coachella at 8 days and Mardi Gras at 6.
Winter Olympics and F1 travellers book slightly later than usual, while the Super Bowl sees the largest last-minute shift, at 5.5 days later than the typical baseline.

How big was the Winter Olympics effect for North American travellers?
Milan captured the larger share of Olympics-driven travel
| Metric | Milan | Venice |
|---|---|---|
| Vs. last year | +247% | +86.7% |
| Median trip length | 9 nights | 8 nights |
| Median fare (CAD/USD) | $957 / $623 | $1,055 / $445 |
| Median advance window | 29 days | 36.5 days |
Milan Captured the Lion’s Share of Olympics Travel
Milan drove nearly 3x the growth of Venice (+247% vs. +86.7%), making it the clear center of gravity for North American Olympics travel, with travellers booking slightly closer to departure and staying a bit longer than those going to Venice.